For decades, the UK North Sea has been a testbed for pioneering technologies used to produce billions of barrels of North Sea Oil & Gas, underpinning the UK’s energy security, and now with the energy transition we are actively engaged in managing the transition to renewable energy and carbon reduction technologies to reduce the impact on the earth's climate.
In support of our Strategy the NSTA has a role in the development and deployment of technologies which support energy security and emissions reduction.
We gather information from Operators about the technologies they have already installed and their efforts to identify solutions which could enhance operations in future.
This information is collated and analysed to create insights for the benefit of the Operators and published in the NSTA’s annual Technology Insights report to raise awareness of technologies which are having a positive impact and to accelerate their deployment across the North Sea.
This consolidated view of technology deployment by Operators is an important indicator of the state of the industry to meet current needs and to highlight priority areas of focus to help prepare for the future.
55 UKCS Operators completed the annual Technology Survey and submitted Technology Plans by the end of March 2023.
There was strong evidence of a continuing focus on technologies for the effective and cost-efficient development of remaining hydrocarbon resources, complemented by efforts to reduce emissions.
Notable examples:
Drilling and well construction
- Low-cost platform modular drilling rig systems
- Lightweight compact trees
- Thru-tubing isolation barrier valve
- Digital well planning using AI

Facilities Design and Inspections
- Cost efficient pipelines and longer tie-backs
- Subsea gas compression and multiphase boosting
- Compact/effective fluid separation
- Non-intrusive inspection technologies
- Controls and automation

Well intervention
- Wireless downhole surveillance technologies
- Disposable fibre-lines
- Retrofit DHSVs and ESPs
- Water shut-off solutions

Emission reduction
- Enhanced emissions monitoring – including fugitives and flare efficiency
- Vapour recovery systems
- Electrification

Technology Survey & Plans
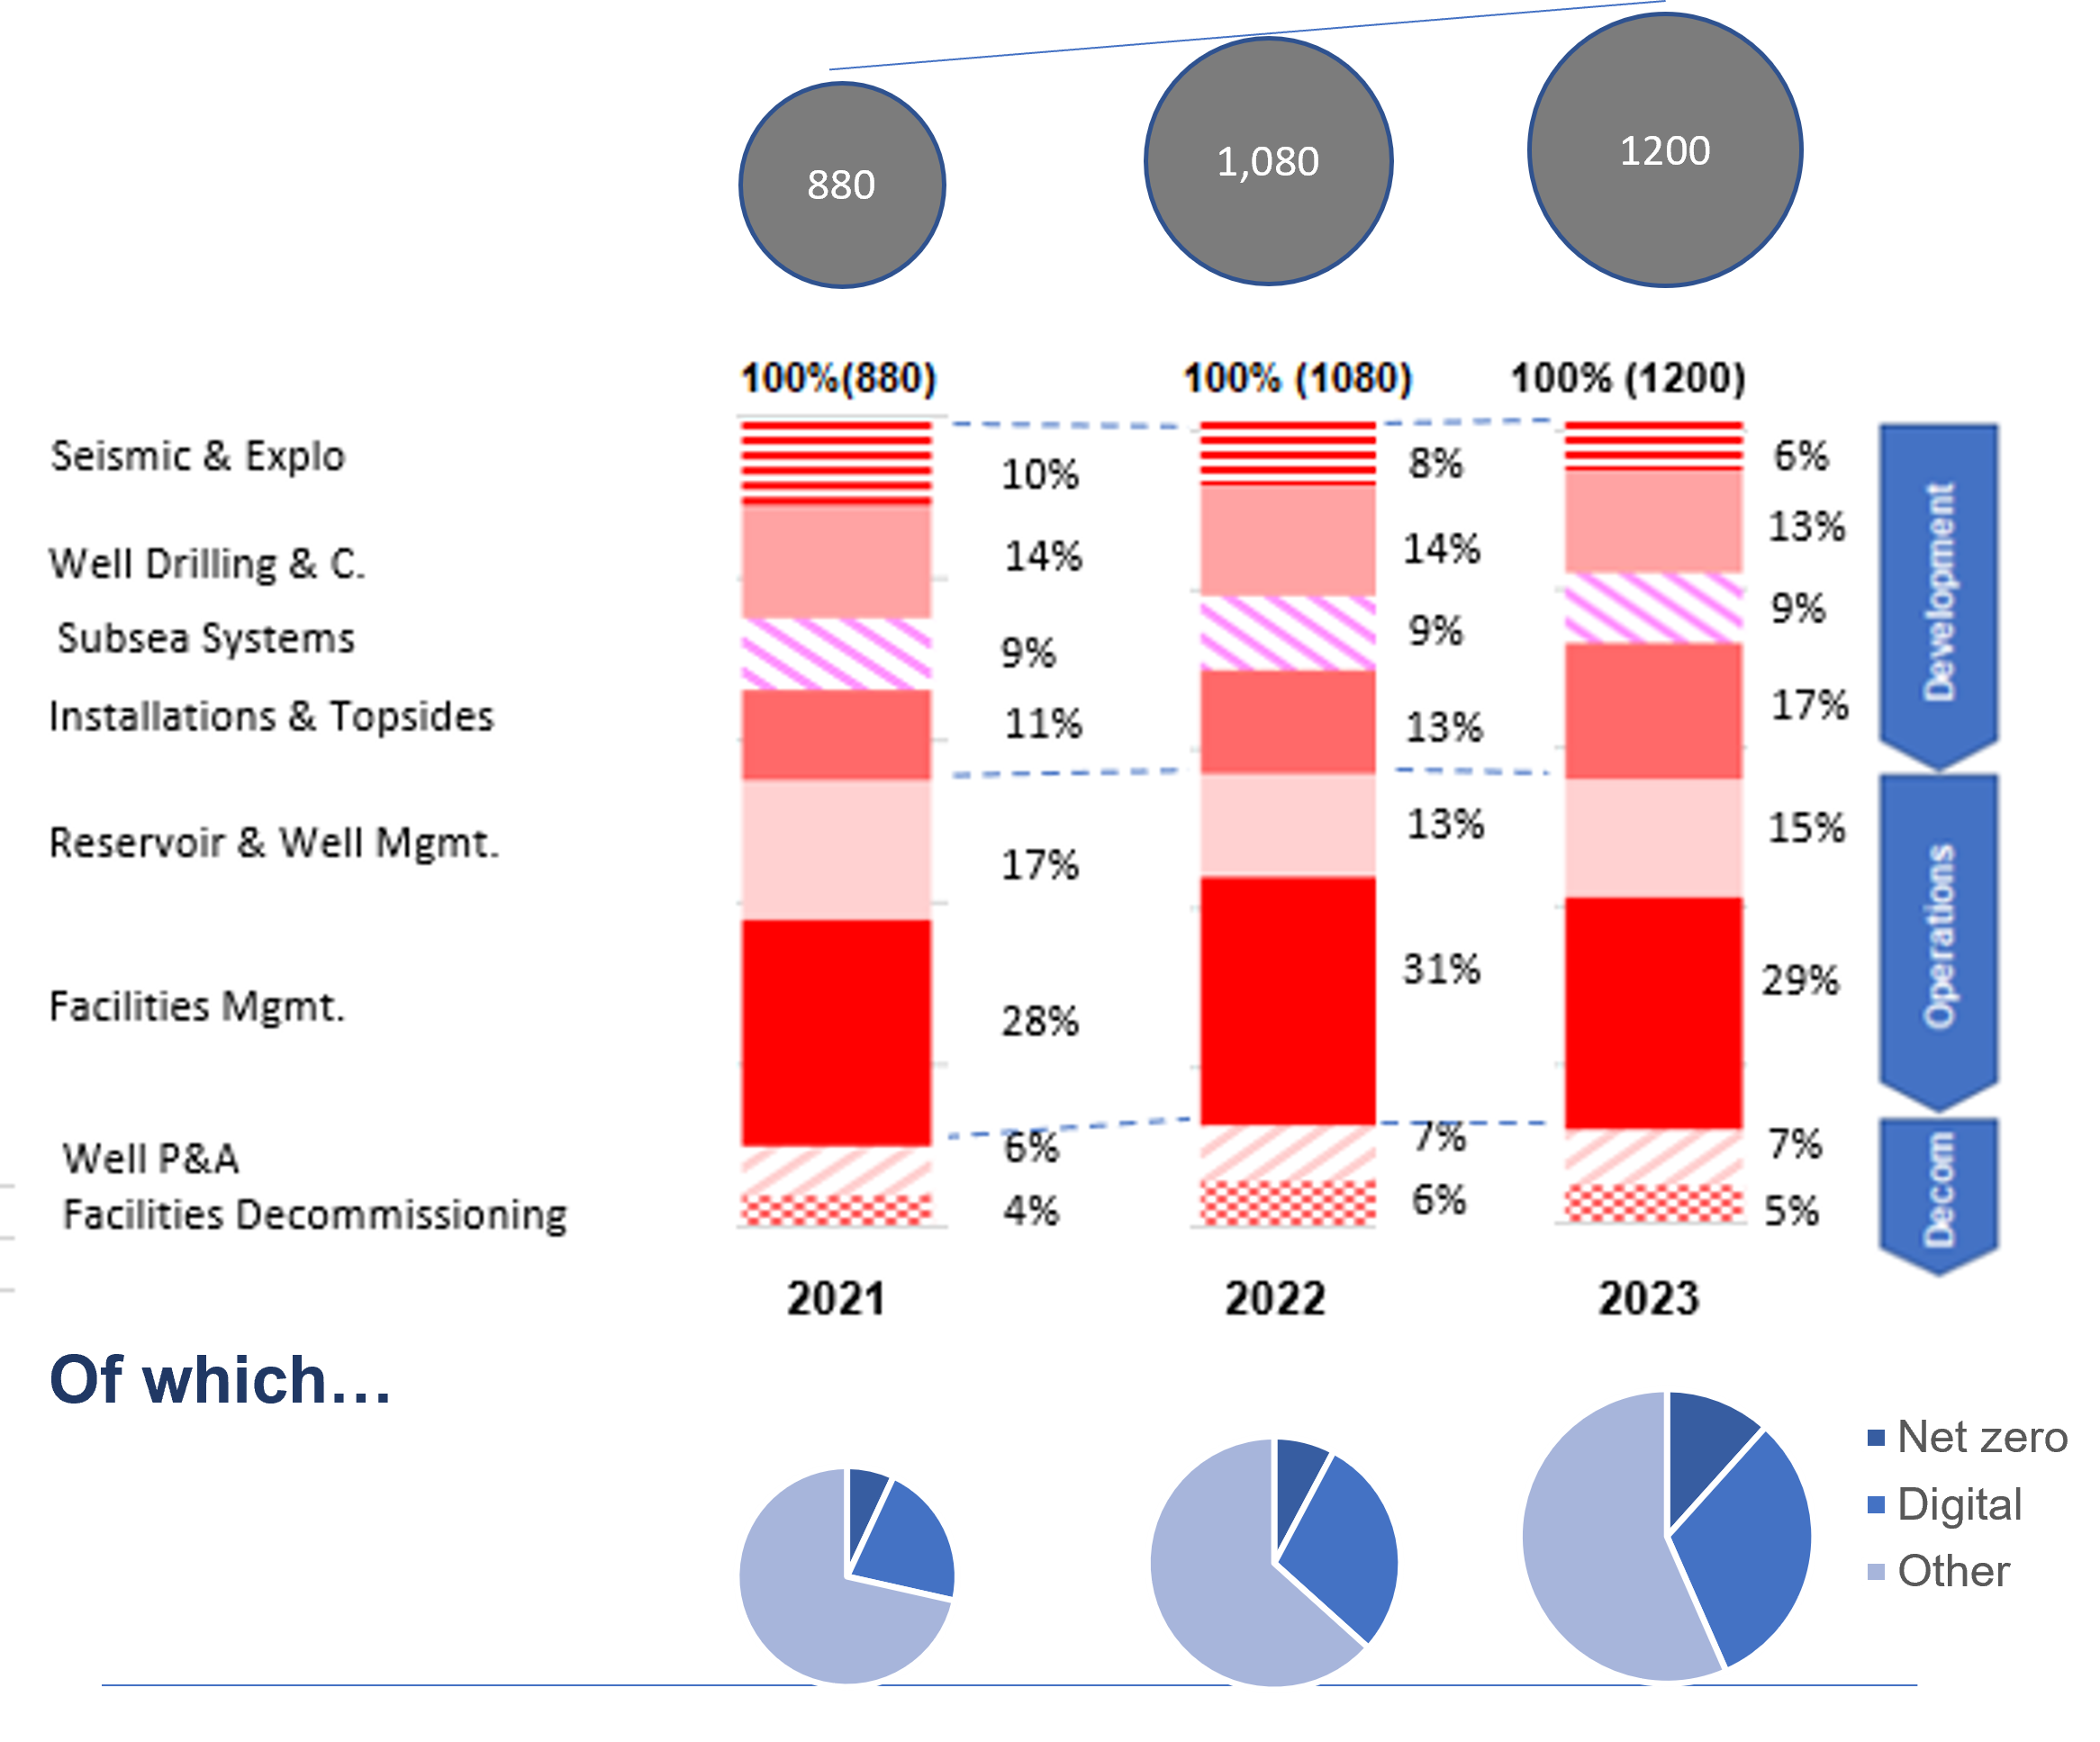
- 1,200 technologies referenced in 2023
- This net increase accounts for removal of successful technologies now considered mainstream and unsuccessful technologies after their screening and pilots
- Nearly equal split between technologies for new asset development and those for asset operations (Reservoir, Wells and Facilities)
- Facilities engineering (Installation & Topsides) growing significantly because of recent focus on emission reduction
- Digital and Net zero themes, which cut across all these domains, are expanding rapidly
Number of technologies reported (UKCS operators)

Operators’ Technology Uptake & Sources
- Focus on active technology management among UKCS Operators has increased steadily
- 20 Operators are reporting more than 10 distinct technologies - from a much lower base of 12 operators in 2020
- Over half of the technologies are sourced directly from vendors/suppliers and this trend is confirmed this year
- However, in over 30% of the cases, Operators actively partner with selected suppliers to develop solutions in partnership, and/or form Joint Industry Projects
- There is a visible contribution of the Net Zero Technology Centre (NZTC) in supporting and facilitating technology innovation (10% of overall technologies surveyed)
Number of technologies reported by Operator
Technology sourcing
Operators’ Technology Spend
- Operators make a sizeable contribution to technology research and development (R&D) for UKCS needs
- In 2023, £65m of direct R&D spend are targeted, in line with previous years, but less than a decade ago (Note: These are “money of the day” values (not factored for inflation).
- The Technology Transfer spend (defined as the cost to deploy the technologies in the field) is higher than the direct R&D expenditure, in line with the somewhat greater Operators’ focus to source field-ready technologies from vendors/suppliers
- Exploration and Development (from Wells to Installations), attract the largest proportion of Operators’ technology spend, in line with the more competitive nature of these areas
- In Operations and Decommissioning, on the contrary, a greater reliance of sourcing of vendors’ solutions is observed
Direct spend on technology


